“If you’re looking for a storage for your data, you can use Microsoft Access instead, but its seems to be more difficult to deal with compare to Microsoft Excel. (Small businesses). If you don’t want to use Microsoft Access, here deal with user-friendly Microsoft Excel. “
Accounting is part of our daily lives, even in your personal life. Like if, you are buying fruits in the market of which part of this will consumed or part of this will resell to your customers at your selling price everyday. And everyday there’s a transaction, but how will you handle this data for your analysis? Well we can keep Accounting Data Records ,simplified and organized using what we called Worksheet or General Journal book. (Manually)
What if, you got a lot of unexpected customers in just a certain period. Over thousands of fruits were buying and selling, can you handle this large, complicated, and unstructured data? how?
Indeed we can handle it in no time, how? it’s easy, if you have your Microsoft Excel (i preferred Excel 2007 up) installed on your computer, then this is it!
Let’s begin with the idea, the idea of how we organize our data
Usually, I start with the Data Entry
(assuming merchandising business)
- Open your Excel Program
- Rename your worksheet as “Data Entry Purchases”
- Now, think what are the factors that will affect the transactions. Examples
- Date
- Items
- Quantity
- Selling Price
- Unit Cost
- Total Sales
- Total Cost
- Customer/Client’s Name
- Address
- Document Numbers
- Others
- We now had the factors to be considered. Next copy the Raw data (below) into your worksheet “Data Entry Purchases”. Paste into cell “A1”
-
Date Items Quantity (kg) Unit Cost Total Cost Docs No. Transaction no. 8/1/2015 Orange 20 90 1800 1 8/1/2015 Banana 35 55 1925 1 8/1/2015 Apple 20 90 1800 1 8/1/2015 Mango 50 50 2500 1 8/1/2015 Avocado 15 30 450 1 8/4/2015 Orange 25 90 2250 2 8/4/2015 Banana 40 55 2200 2 8/4/2015 Apple 24 90 2160 2 8/4/2015 Mango 55 50 2750 2 8/4/2015 Avocado 10 30 300 2 8/7/2015 Orange 23 92 2116 3 8/7/2015 Banana 35 58 2030 3 8/7/2015 Apple 24 93 2232 3 8/7/2015 Mango 51 95 4845 3 8/7/2015 Avocado 16 25 400 3 Note: You will notice the formatting is like presenting in a table, the reason why is to handle easily by the system in well organized manner. I recommend this format so that you don’t have to worry in creating an output data.
- Insert another sheet, name it to “Summary of Purchases”
- Note: It’s very easy to make a report than to make a data entry
- Using Pivot Table, it’s easy to summarize our work and it is very flexible.
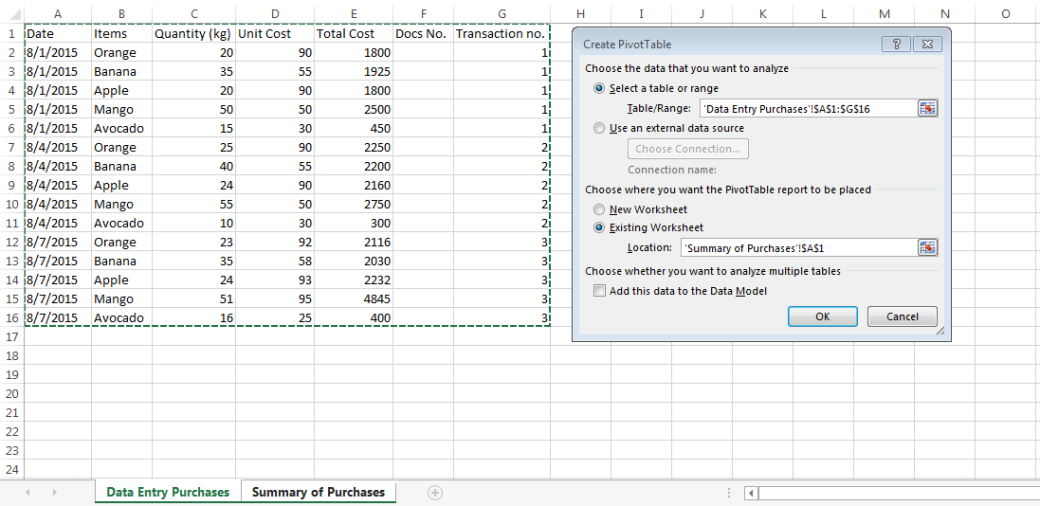
- Create Pivot table by going to Insert Tab, click Pivot table (leftmost)
- On the Pivot Wizard
-
In “Select a table or range”, select your raw data in Data Entry Purchases Sheet
-
Then set your location where you to put the pivot table. Click OK
-
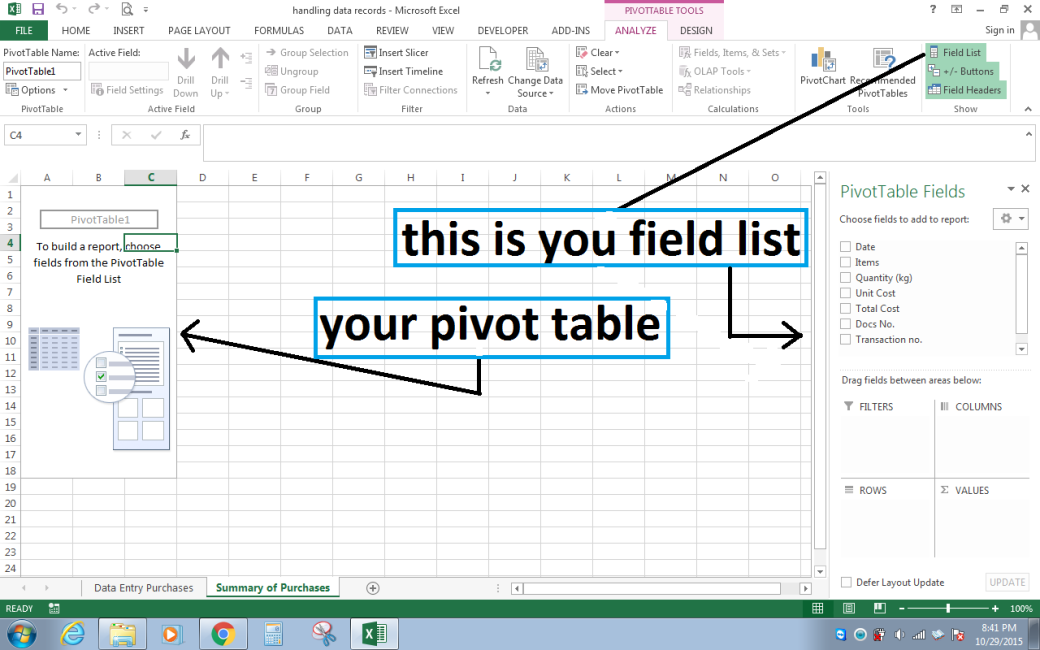
In your Analyze tab or Options (Excel 2007 or 2010) you can see this image below.
-
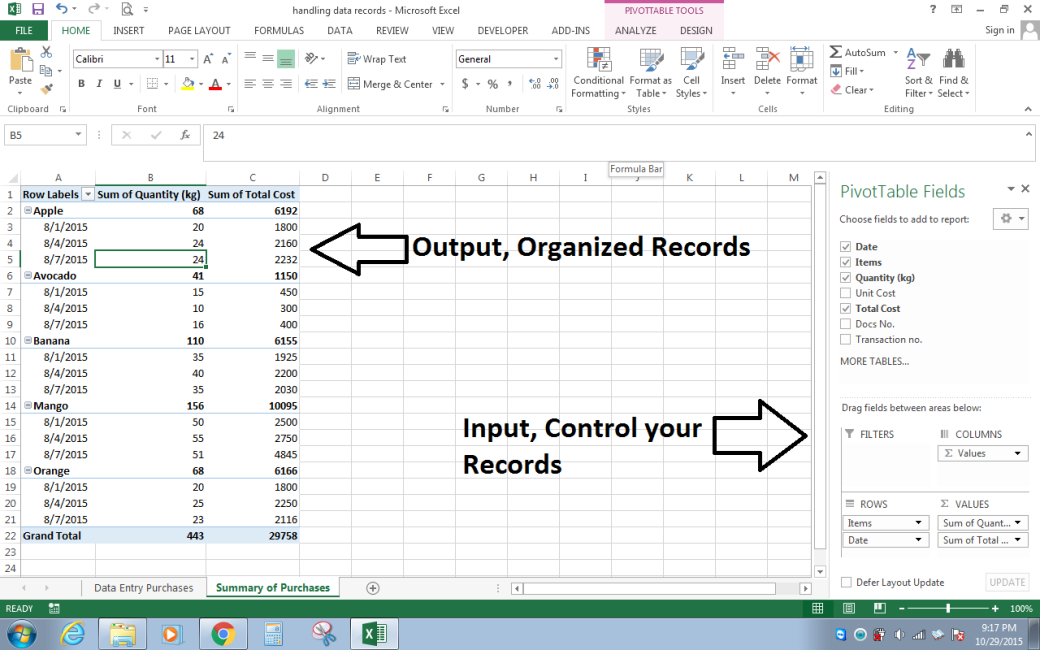
On your Pivot table, you will see here is your summarized records.
-
And on your Field List or PivotTable field you will manipulate(control) your data of how will you organized it.
-
From the field list, drag down the “Items” to “Rows” area
-
The “Quantity (kg)” to “Values” area , the “Total Cost” to “Values”, and
-
The “Date” to “Rows” area.
-
As you can see, “Items” is in the first place in “Rows” area, when you prioritized “Items” in the list, it will dominate this field over another field.
-
Look at the Output, see “Items” over “Date”, that’s why Apple is Primary Heading and Dates are Subheading


